


5 jours par semaine de 8h30 à 17h30

How to Compare Grease Filter Test Reports at Matched Face Velocity and Particle Size
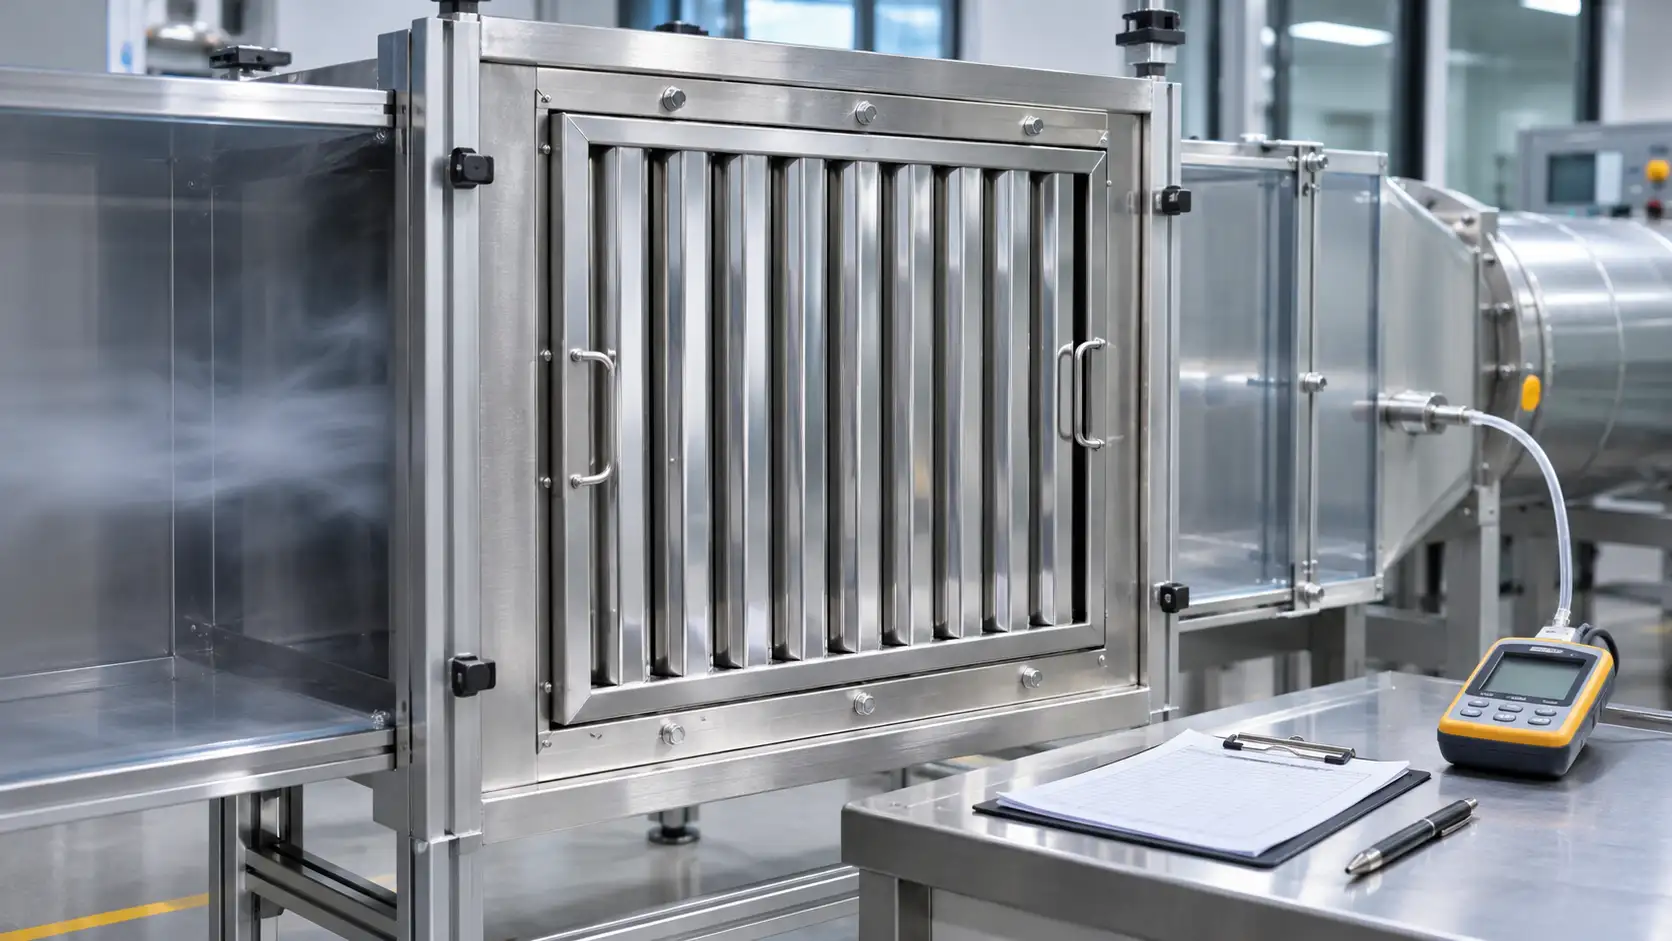
Compare grease filter test reports only after aligning the tested construction, airflow basis, particle size and pressure measurement boundary. A higher capture percentage becomes meaningful when both reports describe the same comparison conditions. Start with the underlying tables and curves, then document which results can support your hood specification.
For equipment manufacturers and distributors buying baffle grease filters, this review can prevent an unsuitable substitution before sample approval. It also produces a precise question for the supplier when two quotations contain impressive numbers that describe different operating points.
Match the report to the filter being quoted
Record the report number, issuing laboratory, test date, method edition and exact specimen identification. Connect that identification to the quotation, drawing revision and sample label. Keep a photograph of the tested assembly with its dimensions and airflow direction.
Un BH222 square grease filter can be specified in several dimensions and depths. A report for one configuration needs an explicit scope statement before it supports another size. Ask which construction details were held constant and who accepts the proposed extension of the results.
Check whether the specimen was a single filter, a complete filter bank or a combined separation assembly. Include any prefilter, secondary stage, mounting frame and perimeter seals in the record. A quotation for one removable component needs evidence that identifies that component’s contribution or the complete assembly that must be supplied with it.
Keep commercial descriptions separate from specimen identity. “Stainless steel baffle filter” covers many channel arrangements. A matching photograph helps, while a revision-controlled drawing establishes which physical version the report represents.
Establish what each result actually measures
ASTM F2519-05(2025) addresses grease particle capture by particle size and pressure drop as airflow changes. Its scope covers new or clean filters. Treat its results as evidence for the tested clean configuration, with separate consideration of service conditions and the equipment approval required for the installation.
Write the reported quantity beside each number. Particle capture efficiency, pressure drop and an overall mass-based figure answer different questions. An overall figure also needs its weighting basis. The particle distribution used to calculate it can affect how much each size contributes to the result.
Use the following comparison record before ranking suppliers.
|
Report field |
Information to record |
Question if missing |
|
Specimen |
Model, dimensions, depth and stages |
Which quoted assembly was tested? |
|
Flow condition |
Air volume, face velocity and area definition |
How was velocity calculated? |
|
Capture result |
Particle diameter, units and curve or table |
Which particle sizes support the claim? |
|
Pressure result |
Pressure difference, flow and measurement boundary |
Which components are included? |
|
Evidence quality |
Method, uncertainty and scope notes |
Which differences can the laboratory resolve? |
Retain the original report with the completed record. Transcribing a single headline percentage into a purchasing spreadsheet removes the conditions that make the number interpretable.
Check the pages surrounding the result as well. A scope note may identify a seal arrangement, a specimen mounting detail or an excluded condition that changes how the figure applies. If a sales summary and the signed report disagree, return the discrepancy to the issuer and retain the corrected reference.
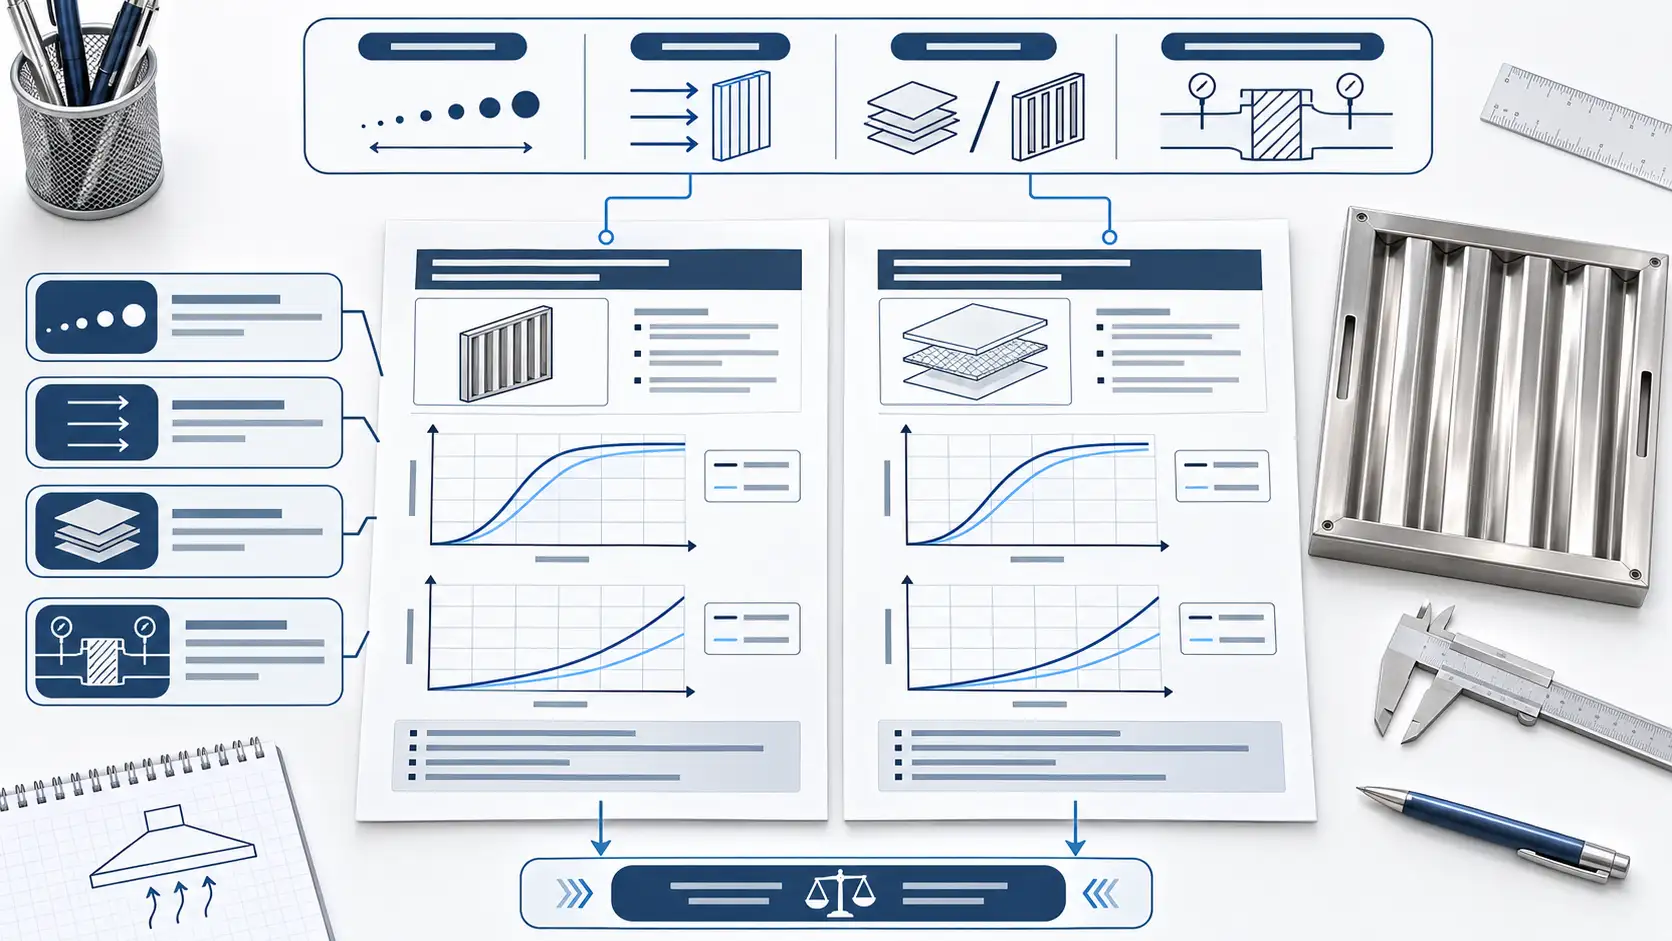
Calculate face velocity using the same area definition
Face velocity is volumetric airflow divided by the stated face area. Convert the units before dividing. For several parallel filters, first establish the relevant bank area and the airflow assigned to that bank. Dividing the total hood flow by the area of one panel produces the wrong comparison.
Hypothetical example of an area mismatch
Suppose a report gives airflow of 900 cubic metres per hour through a gross face area of 0.25 square metres. Dividing by 3,600 converts the airflow to 0.25 cubic metres per second. The resulting gross face velocity is 1 metre per second.
A second specimen receives the same 900 cubic metres per hour across 0.125 square metres. Its gross face velocity is 2 metres per second. The matching airflow figures therefore describe different velocities through differently sized faces. These numbers illustrate the calculation only and represent no Simple test result.
Next confirm the area convention. Gross frontal area, usable face area and open passage area are different definitions. Record the dimensions and definition behind each stated velocity, then ask the laboratory to reconcile inconsistent conventions. Keep the original test values visible beside any calculated values.
This arithmetic aligns the flow description. It cannot generate a new capture curve for a different filter size or velocity. Obtain supporting data for the required operating point when the available report does not cover it.
Compare capture at matching particle sizes
Read the horizontal axis, diameter units and particle-size definition before comparing the vertical values. Request tabulated data if the graph is too small to read reliably. Mark the operating velocity associated with each curve, including any legend that distinguishes separate runs.
Consider another hypothetical quotation comparison. Supplier A states 80 percent capture at 5 micrometres. Supplier B states 90 percent at 10 micrometres. Both figures may accurately describe their respective tests. They leave the buyer without a matched particle-size comparison. Request results at common sizes and comparable flow conditions before placing them in a ranked column.
Avoid filling missing points with a straight line simply to complete the spreadsheet. Where interpolation is proposed, ask the laboratory to confirm whether it is appropriate and to identify the uncertainty. Extrapolation beyond the measured range requires particular attention because the report contains no direct observation there.
Channel geometry also belongs in this review. A Z-shaped baffle filter identifies a particular construction approach. Its name alone cannot supply the capture values needed for a report comparison. Carry the construction identifier into the evidence request so the returned data address the actual quotation.
Read pressure drop at the selected operating point
Place the pressure-drop value beside the capture result for the same operating condition. Confirm the units and whether the recorded difference spans the filter alone, its mounting assembly or several treatment stages. A pressure value from another boundary needs clarification before it enters the hood calculation.
Ask the ventilation designer to identify the filter-bank duty and allowable pressure contribution. The buyer can then request evidence at that duty instead of choosing whichever catalogue point appears most favourable. Keep the designer’s selected point marked on the supplier’s curve.
For a bank containing mixed panel sizes, ask how the designer assigned airflow to each panel group. Total bank flow and total area provide an average. The intended distribution still needs confirmation before individual panel data are used in the equipment selection.
If one report provides pressure data at several flows and another provides a single point, record that difference explicitly. Additional measurements may be needed to compare the intended duty or a permitted operating range. A fan adjustment also requires an equipment-level review because the filter operates within a complete exhaust system.
Resolve mismatches before purchase approval
Classify each comparison as directly comparable, comparable with a documented qualification, or awaiting additional evidence. Give every open item an owner and a requested document. This makes the follow-up specific enough for a laboratory or supplier to answer.
For example, request a curve for the quoted depth at the specified face velocity, with the test frame identified. That question is more actionable than asking for “better efficiency.” Where measurement uncertainty is available, ask whether the apparent difference supports a meaningful ranking.
Retain the approved report revision in the purchase specification. Record the construction features covered by that approval and require review of proposed changes to channels, depth, stages or mounting. A later substitution should return to the same comparison conditions before release.
For a preliminary sourcing review, send Simple the required filter dimensions, drawing, filter-bank airflow and available report references. Request a grease filter quotation with the evidence needed for your engineering review clearly identified.
FAQ (questions fréquentes)
Can equal airflow make two reports comparable
Equal airflow is one condition. Face area, area convention, construction, particle size and measurement boundary also need alignment. Record these fields before comparing the numerical results.
Can a percentage be compared with an efficiency curve
Locate the percentage on the curve using its particle size and flow condition. An unspecified percentage leaves that correspondence unresolved. Ask for the underlying data and the basis of any overall figure.
Does a test on one size cover every size
Coverage depends on the report scope and an accepted technical basis for extending it. Ask the responsible reviewer to document which sizes and construction revisions the evidence supports.
What should a buyer do when uncertainty is absent
Request the laboratory’s available uncertainty statement and limitations. Keep a small apparent difference qualified while its significance remains unresolved. Avoid creating precision by rounding graph readings to extra decimal places.
Can clean-filter data predict performance after cleaning cycles
Service history introduces additional conditions. Define any required cleaning-cycle or used-condition evaluation separately, with the responsible engineer approving the procedure and acceptance criteria.
